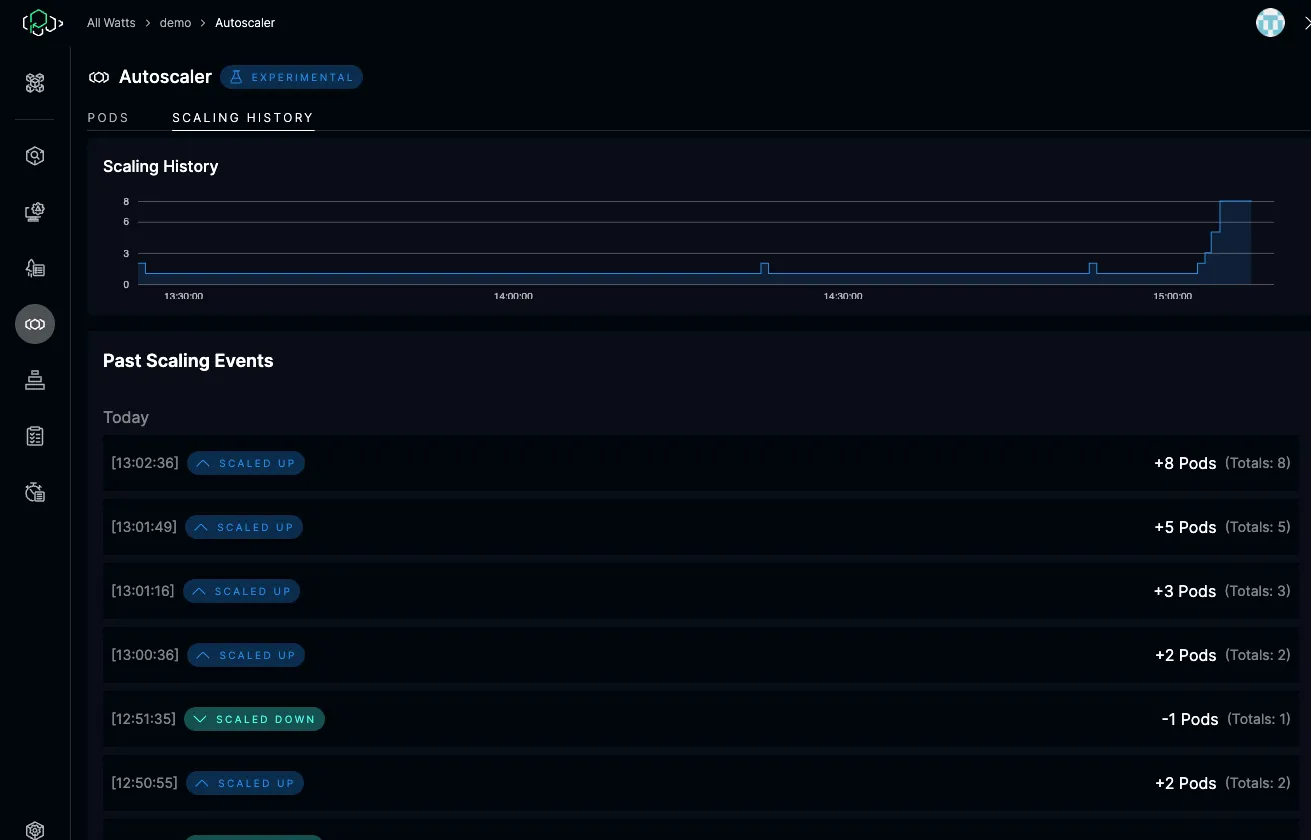
Autoscaler
Scaling overview
Section titled “Scaling overview”ICC supports an Open Source reactive scaler (V1) and an Enterprise predictive scaler (V2). The ICC deployment selects one version with PLT_SCALER_ALGORITHM_VERSION.
This page describes the application instance and scaling-event information available in the Autoscaler area. V2 deployments also provide prediction details and the Planner.
The Autoscaler page
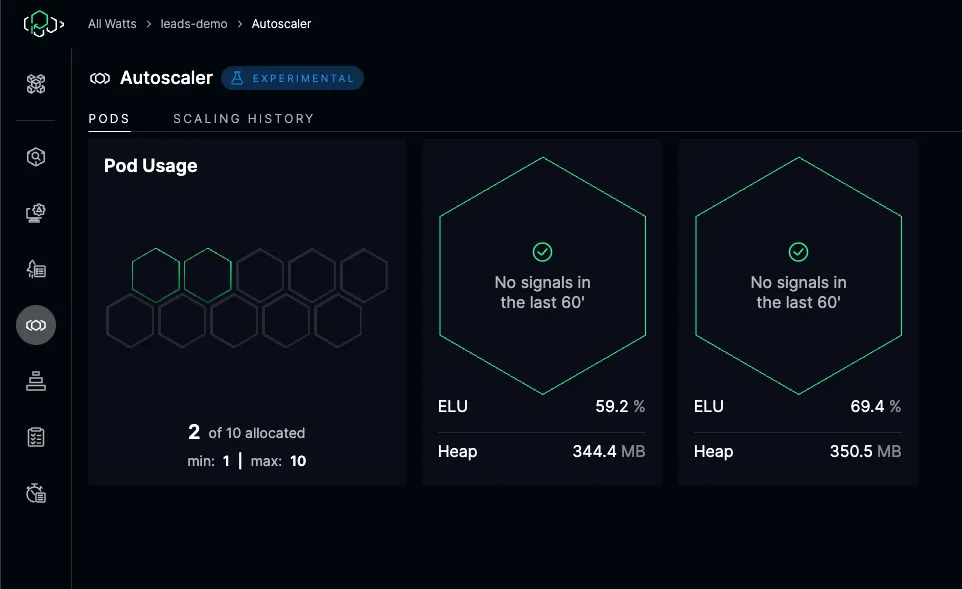
Section titled “The Autoscaler page”On the Autoscaler page, you can see information about application instance status and scaling events.
This image shows two instances in a healthy state.
Instances can also be unhealthy, in which case the selected scaler evaluates whether more capacity is required.
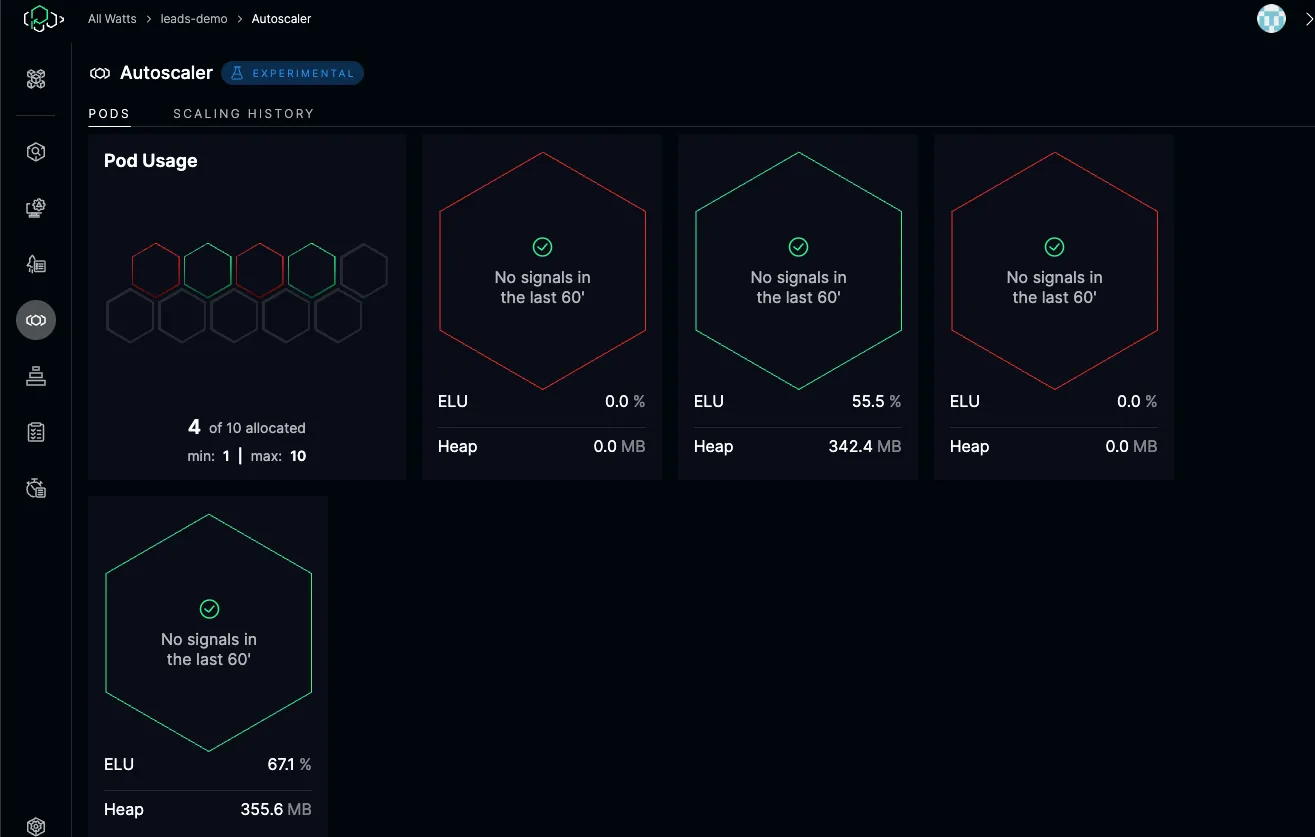
The overview shows the running instances, their latest signals, ELU and heap metrics, and health state.
Clicking on one of the instances will send you to the Pod Detail section.
Pod Detail section
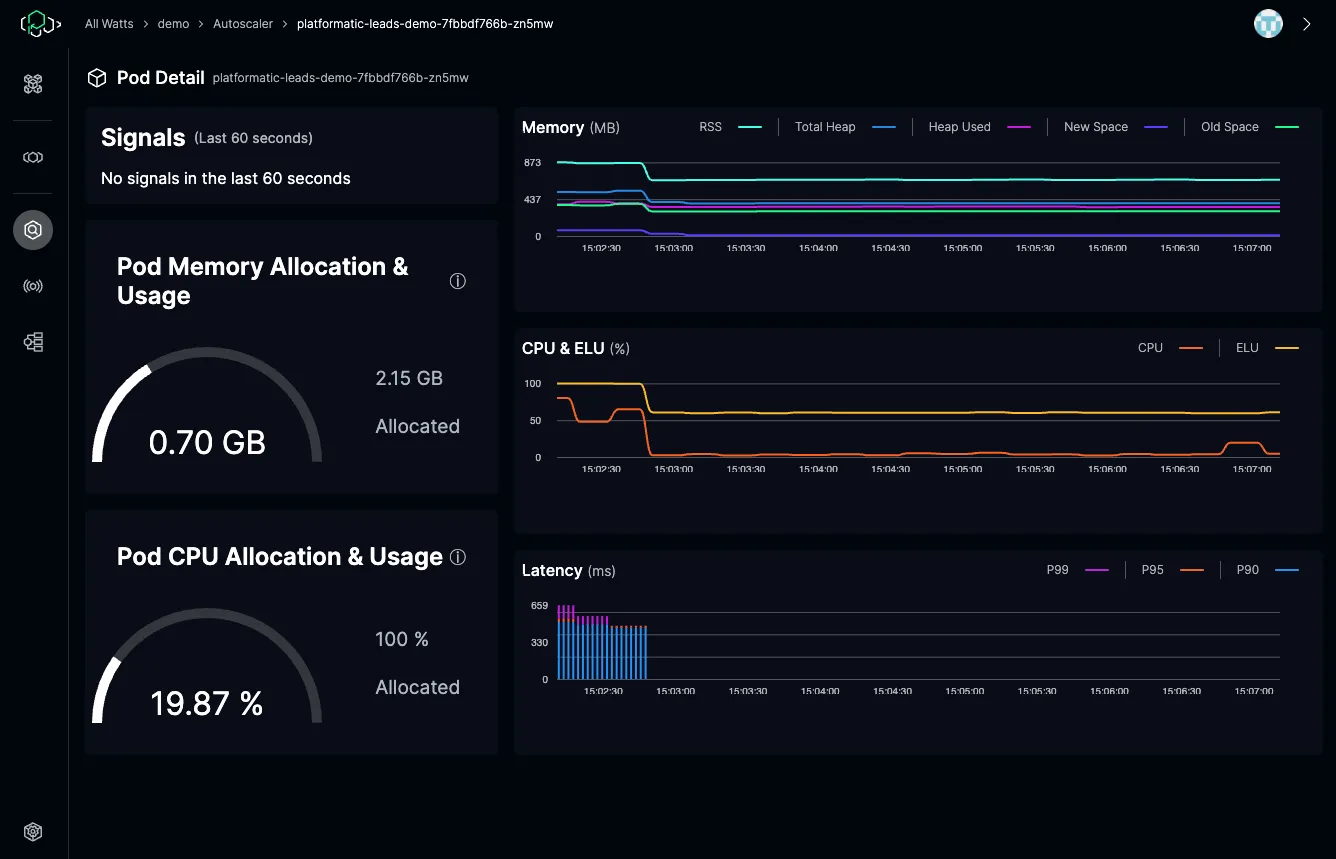
Section titled “Pod Detail section”The Pod Detail area has its own sidebar. The first page shows:
- The latest signals received
- Memory/CPU usage graphs
- historical CPU, ELU, memory, and latency trends.
The Signals History page lists the latest signals.
Selecting a signal opens its details and explains its cause and effect. If it produced a scaling event, the details link to the Scaling History with that event highlighted.
Scaling History section
Section titled “Scaling History section”This section lists scaling events generated by ICC. Selecting an event shows its reason and, when collected, the associated application metrics.